FusionCharts XT can effectively be used in ASP.NET AJAX Update Panel to plot dynamic data-driven charts. In this example, we will show a few basic examples to help you get started.
We will cover the following examples here:
- Using FusionCharts XT in an Update Panel taking data from a database.
- Using two charts from FusionCharts XT pack, one of which affects the other chart in an Update panel.
Let's quickly see each of them.
Before you go further with this page, we recommend you to please see the previous sections Basic Examples and other subsequent pages as we start off from concepts explained in that page.
We will create three UpdatePanels:
- First on top with the RadioButtonList control to select Factory Name (ID:- FactorySelector)
- Left - with a GridView control showing selected Factory's output data -(ID: GridUP)
- Right - with a Column2D chart (using FusionCharts XT) to show factory output data (ID: FusionChartsUP)
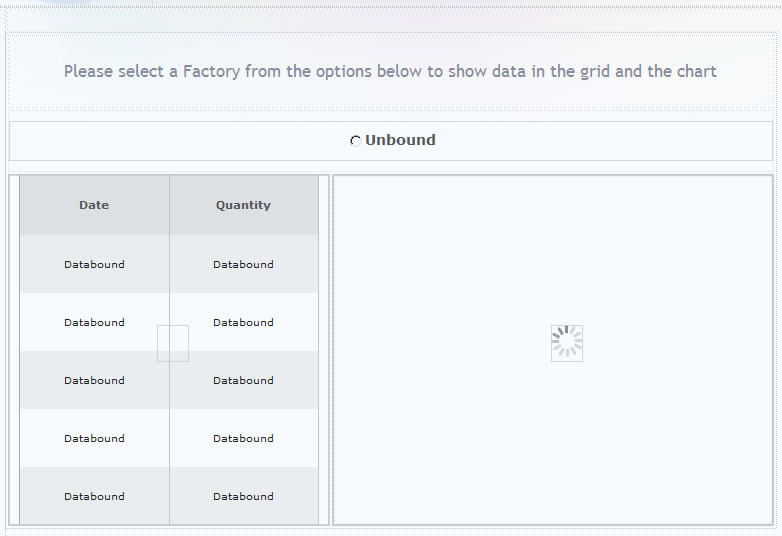
The design view will look like this :
In the HTML head section we load both FusionCharts.js and jquery.min.js. Please note that jQuery is required to run this example.
<script type="text/javascript" src=../FusionCharts/jquery.min.js"></script>
<script type="text/javascript" src="../FusionCharts/FusionCharts.js"></script>
Let's look at the UpdatePanel code for the FactorySelector: (Sample1.aspx)
<asp:UpdatePanel ID="FactorySelector" runat="server">
  <ContentTemplate>
     <asp:RadioButtonList ID="RadioButtonList1" runat="server" AutoPostBack="True" Height="40px"
        OnSelectedIndexChanged="RadioButtonList1_SelectedIndexChanged" Width="400px"
        RepeatDirection="Horizontal" Style="font-weight: bold; font-size: 14px; font-family: Verdana" ForeColor="#404040">
     </asp:RadioButtonList>
  </ContentTemplate>
</asp:UpdatePanel>
Here, we set a code behind function to be called when selection changes. Since AutoPostBack is set to true it will invoke AJAX call.
We also add a JavaScript reference updatepanelhook.fusioncharts.js to the Script Manager. This script adds Update Client Side event listeners and takes care of the final rendering of the chart in the browser. The code to add this reference is as follows:
<asp:ScriptManager ID="ScriptManager1" runat="server">
   <Scripts>
      <asp:ScriptReference Path="~/UpdatePanel/updatepanelhook.fusioncharts.js" />
   </Scripts>
</asp:ScriptManager>
The UpdatePanel code that will contain the chart is simpler.
<asp:UpdatePanel ID="FusionChartsUP" runat="server">
   <ContentTemplate>
     <asp:Panel ID="Panel1" runat="server" Height="350px" Width="440px"></asp:Panel>
   </ContentTemplate>
</asp:UpdatePanel>
Here we place a Panel control where the chart will be loaded.
Now let's find out what happens in the code-behind (Sample1.aspx.cs) function RadioButtonList1_SelectedIndexChanged() when a Factory is selected :
protected void RadioButtonList1_SelectedIndexChanged(object sender, EventArgs e)
{
  //Update FusionCharts XT and gridview with as per selected factory
  updateChart();
}
It calls the UpdateChart() function. Let's trace it:
private void updateChart()
{
   //Get the factory details depending on the FactoryID from selected Radio Button
   string strSQL = "select DatePro, Quantity from Factory_Output where FactoryId=" +  RadioButtonList1.SelectedValue.ToString() + " order by DatePro";
   //Create data reader to bind data with GridView
   DbConn rs = new DbConn(strSQL);
   //Fillup gridview with data from datareader
   GridView1.DataSource = rs.ReadData;
   // binding the data
   GridView1.DataBind();
   //Create database connection to get data for chart
   DbConn oRs = new DbConn(strSQL);
   //Create FusionCharts XT XML
   StringBuilder strXML = new StringBuilder();
   //Create chart element
   strXML.AppendFormat("<chart caption='Factory {0}' showborder='0' bgcolor='FFFFFF' bgalpha='100' subcaption='Daily Production' xAxisName='Day' yAxisName='Units' rotateLabels='1'  placeValuesInside='1' rotateValues='1' >", RadioButtonList1.SelectedValue.ToString());
   //Iterate through database
   while (oRs.ReadData.Read())
   {
      //Create set element
      //Also set date into d/M format
      strXML.AppendFormat("<set label='{0}' value='{1}' />", Convert.ToDateTime(oRs.ReadData["DatePro"]).ToString("d/M"), oRs.ReadData["Quantity"].ToString());
   }
   //Close chart element
   strXML.Append("</chart>");

   //outPut will store the HTML of the chart rendered as string
   string outPut = "";

   //when a ajax call is made we use RenderChart method
   //When the page is loaded for the first time, we call RenderChart() method
   outPut = FusionCharts.RenderChart("../FusionCharts/Column2D.swf", "", strXML.ToString(), "chart1", "445", "350", false, false);

   //Clear Panel control which will contain the chart
   Panel1.Controls.Clear();
   //Add Literal control to Panel which adds the chart from outPut string
   Panel1.Controls.Add(new LiteralControl(outPut));
   //Close Data Reader
   oRs.ReadData.Close();
}
In the above code we do the following :
- Open the database connection to get data for the selected factory
- Update the GridView control with data from database
- Create the chart XML
- Use the InfoSoftGlobal.FusionCharts.RenderChart method to generate HTML for the chart to be displayed
- Update the Panel control in the FusionChartsUP Update Panel with this HTML for the chart
- At client-side, the updatepanelhook.fusioncharts.js script finally renders the chart
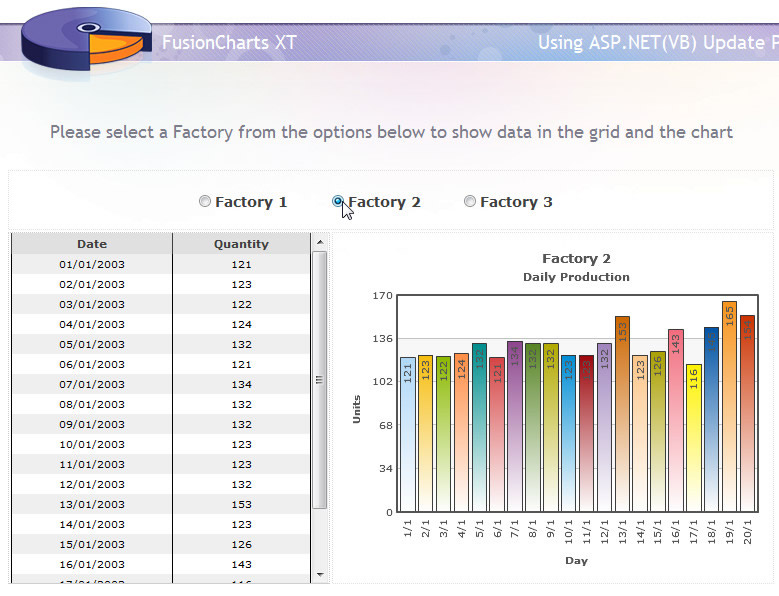
Thus, the chart gets updated in UpdatePanel, using AJAX, each time a factory is selected from the Radio buttons list. Here goes a screenshot of one instance:
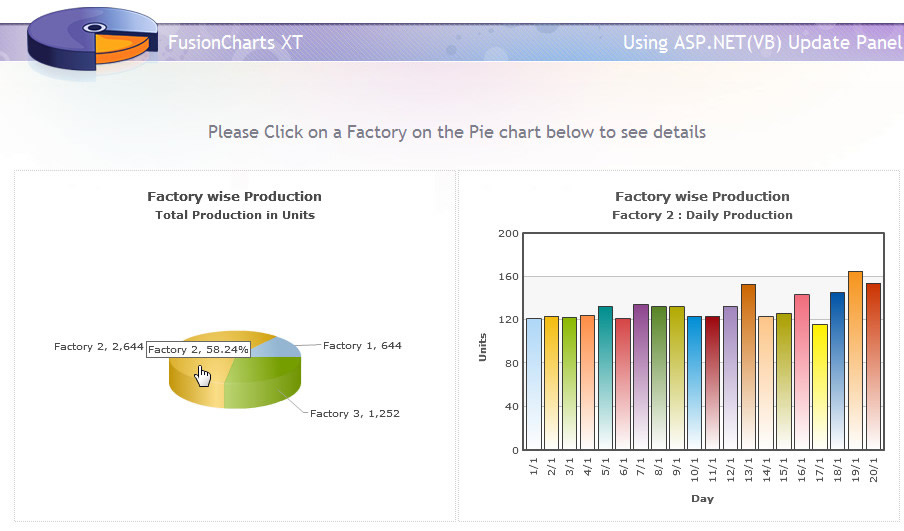
We now modify the sample above to insert two charts. The one on the left, a pie chart with summarized data, shows the total production of each Factory in each slice. On clicking a slice, that is, selecting a Factory, another chart will show up in an UpdatePanel. This Column2D chart, like the previous example, will show the details of the selected factory.
Let's see how the design is modified :(Sample2.aspx)
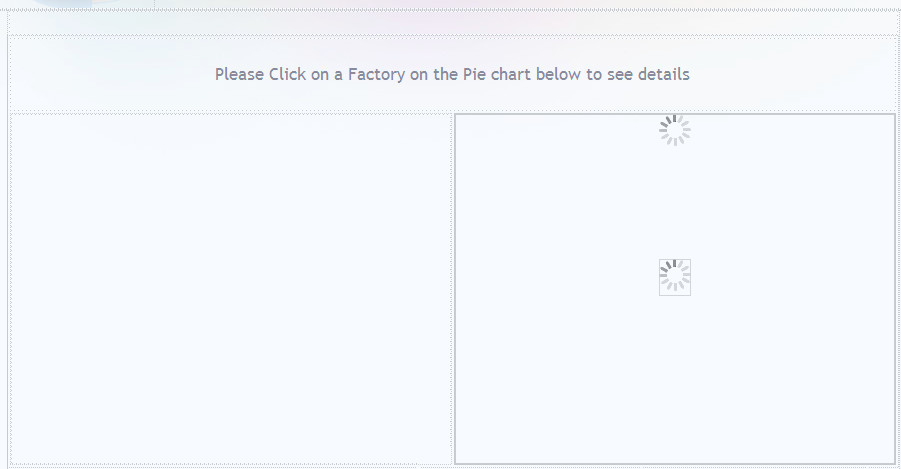
Here, we put only one UpdatePanel, that is, FusionChartsUP that will load up the chart. The HTML code for this remains the same as the previous example. The left part will contain the Pie chart that will load up once, when the page is loaded first. But we also have an added Javascript snippet to include in this page :
<script language="javascript" type="text/javascript">
   //Call Ajax PostBack Function
   function updateChart(factoryId){
      //Call drillDown C# function by Ajax
      //we pass the name of the function ('drillDown') to call
      //and the parameter (i.e., factoryId) to be passed to it
      //both separated by a delimiter(here we use $, you can use anything)
      __doPostBack("Panel1","drillDown$" + factoryId);
}
</script>
Let's now see how the request is treated in the code-behind file Sample2.aspx.cs:
protected void Page_Load(object sender, EventArgs e)
{
   //This will execute first time the page loads and not on ajax post back calls
   if (!IsPostBack)
   {
      // Show a blank Column2D Chart at first
      showColumnChart();
   }
   else
   {
      // Handle Ajax PostBack Call
      // store Asp.Net Ajax special HTTP request
      // __EVENTARGUMENT holds value passed by JS function -__doPostBack
      // The value can be like "drillDown$1"
      // We take $ as delimiter so we get drillDown as the function to call
      //and 1 as the factory id. It can vary depending on the pie slice clicked.

      String sEventArguments = Request["__EVENTARGUMENT"];
      if (sEventArguments != null)
      {
         //extract arguments passed to the HTTP Request
         Int32 iDelimiter = sEventArguments.IndexOf('$');
         String sArgument = sEventArguments.Substring(iDelimiter + 1);
         // extract the name of the post back function
         if (sEventArguments.StartsWith("drillDown"))
         {
            // call the post back function passing the argument(s)
            drillDown(sArgument);
         }
      }
   }
}
The above code is executed whenever a page is loaded or when an AJAX call is made. It does the following :
- It loads a blank Column2D chart (through showColumnChart() function) when the page is loaded for the first time
- On post-back or AJAX calls, it parses the __EVENTARGUMENT request and extracts the name of the function to be called and the argument to be passed to the function. Here, the argument will be the Factory Id.
- Accordingly, the function name that the request variable provides here, is DrillDown and the drillDown() function is called.
- The DrillDown() function is same as the updateChart() function of the previous example, which creates chart XML as per the selected factory and sets the panel with the chart HTML created using the InfoSoftGlobal.FusionCharts.RenderChart function
The final output will look similar to this when a factory pie slice is clicked: